
Dietary Intake and Cognitive Developmental Outcomes of Children Below Five Years Living with Special Needs in Kakamega County: A Baseline Survey
Abstract
In early childhood, adequate dietary intake is essential for optimal growth, brain development, and the acquisition of cognitive skills. However, children with special needs often face increased nutritional vulnerability due to feeding difficulties, restricted diets, metabolic anomalies and limited access to health and care services. These challenges significantly compromise their access to optimal dietary intake that negatively impacts on their cognitive development and functioning. This baseline survey aimed at identifying the existing characteristics of dietary intake and cognitive developmental outcomes of children aged below five years with special needs in Kakamega County. We involved 90 mother/child caregiver-child pair, selected through stratified sampling from early childhood development centers in Kakamega County. Data was collected using 24-hour dietary recall, food frequency questionnaires, anthropometric and Bayley Scales of Infant and Toddler Development (BSID IV) was used for assessment of cognitive development outcomes. Findings revealed high levels of micronutrient deficiencies, with 66.7 percent not meeting recommended intake for vitamin A, 76.7 percent for iron, and 89 percent for zinc. Only 47.7 percent met minimum dietary diversity score. Nutrition assessments showed 52.2 percent of children had normal weight and 6.7 percent were severely undernourished. Feeding dependence varied by disability with 100 percent of children with ADHD self-fed. Cognitive assessments showed that children with physical disabilities had the highest scores across all cognitive domains, while children with autism demonstrated lowest, particularly in communication and executive functioning. In conclusion, the prevalence of nutritional deficiencies as a consequence of sub-optimal dietary intake, particularly in essential micronutrients are closely linked to poor cognitive developmental outcomes. Low levels of nutrition education of parents and feeding dependency negatively impacts on cognitive development outcomes of children with special needs. Thus, implementation of special needs inclusive of nutrition interventions, caregivers’ training and early stimulation programs to support holistic development of these children is needed.
Article Information
- Received
- Accepted
- Published
Academic Editor: Loai Aljerf, Department of Life Sciences, Faculty of Dentistry, University of Damascus.
Checked for plagiarism: Yes
Review by: Single-blind
Copyright © 2026 Lucy Amanya Mutuli.
 This is an open-access article distributed under the terms of the Creative Commons Attribution License, which permits unrestricted use, distribution, and reproduction in any medium, provided the original author and source are credited.
Corresponding author: Lucy Amanya Mutuli, Masinde Muliro University of Science and Technology, Kenya —
Competing Interests
The authors declare no conflict of interest. The funders had no role in the design of the study; in the collection, analyses, or interpretation of the data; in the writing of the manuscript; or in the decision to publish the results.
Funding
This research was funded by the Education Sub Saharan Africa (ESSA) and Research for Equitable Access and Learning (REAL) Centre at the University of Cambridge, with financial support from Conrad N. Hilton Foundation and Global Partnership for Education Knowledge and Innovation. Grant Reference Number (ECDAFRICA001).
Data Availability
No data-availability statement was provided by the authors.
Acknowledgements
We are grateful to all children and their mothers/caregivers who participated and provided valuable input and information. We sincerely thank all the managers of ECD centers that participated in this study.
Citation:
Introduction
Optimal dietary intake in the early years of life is key for ideal growth and cognitive development. A diet of nutrient-dense diet has a direct link to physical and cognitive development of children as they grow into other stages of life 1. Adequate dietary intake particularly in early childhood provides the building blocks for brain development 2. Macro and micronutrients that are key in cognitive development are not limited to carbohydrate, protein, fats, iron, iodine, zinc calcium, magnesium folic acid, vitamin A and B complex 3. These nutrients have been proved to have a direct impact on cognitive function since they are vital for synaptic plasticity, myelination, and neurotransmitter synthesis 4. Deficiency in any of these can lead to delayed cognitive milestones, reduced attention spans, and impaired memory function 5. Therefore, optimal dietary intake in cognitive development is a foundational aspect of childhood that determines how children perceive, think, remember, and learn. This enhances cognitive outcomes essential for social interactions and communication vital for children as they grow-up to form personal and professional relationships, contributing to their overall well-being and success in various aspects of life. In early childhood education, cognitive outcomes are foundational to the learning process since they facilitate the acquisition of knowledge and the development of critical thinking abilities in children 6. Therefore, children with special needs are more vulnerable to sub-optimal dietary intake due to feeding challenges, physical limitations, and limited access to appropriate nutrition that ultimately impact on their cognitive development outcomes. However, among the most critical yet often overlooked contributor to cognitive development outcomes is optimal dietary intake yet there has been increasing recognition of its role in influencing neurodevelopmental outcomes. In low-resource settings such as Kakamega County, Kenya, there is limited data on dietary intake and cognitive development of children aged below five years living with special needs. Children of this County with special needs face numerous systematic and contextual challenges while their caregivers and educators lack the resources and expertise needed to provide optimal diets into their daily routines 7. Most interventions in this region have focused narrowly on formal academics and medical support, often overlooking the integrated role of dietary intake as a critical component of holistic development 8. This study aimed at identifying and understanding the baseline characteristics of dietary intake and existing cognitive outcomes of children aged below five years with special needs in Kakamega County; thus providing a foundational snapshot preceding an integrated intervention.
Aim of the Research
Assess the baseline characteristics of dietary intake and cognitive development outcomes of children aged below five years with special needs in Kakamega County.
Problem Statement
Despite the rising enrollment of children with special needs in educational and care institutions in Kakamega County, there is a lack of baseline data on their dietary intake and how it impacts cognitive development outcomes. This knowledge gap limits effective nutritional and educational interventions for this vulnerable group.
Significance of the Study
This study provides foundational data on dietary intake and cognitive development outcomes of children aged below five years with special needs so that to inform policy, support service planning and enhance inclusive early childhood development programs in underserved areas such as Kakamega County.
Conceptual Framework
This conceptual framework Figure 1 is built on the understanding that optimal dietary intake is a key pillar of early childhood development, particularly for children with special needs, who may have unique cognitive development challenges. The framework highlights how optimal dietary intake functions through physiological and psychosocial pathways to enhance cognitive development. Input components is optimal dietary intake that includes a balanced intake of macronutrients (carbohydrates, proteins, fats) and essential micronutrients (iron, zinc, iodine, omega-3 fatty acids). This supports: brain growth and myelination, neurotransmitter synthesis and energy supply for learning and engagement. Optimal dietary intake influences cognitive outcomes through three core pathways; a)neurological stimulation, it provides the building blocks for neural networks, b)psychosocial development, enhances mood and emotional stability, enabling better participation in cognitive activities, c)mental health, improves immunity, reduce fatigue, and enhance physical readiness for learning. Intermediate outcomes include short to mid-term observable effects that include; Improved attention and concentration, greater sensory integration, enhanced memory and language development and more responsive behavior and adaptability in learning environments. The ultimate outcome is enhanced Cognitive Development outcomes of Children with Special Needs defined as: Learning abilities, communication skills, problem-solving and reasoning and self-regulation and executive functions.
Figure 1. Conceptual Framework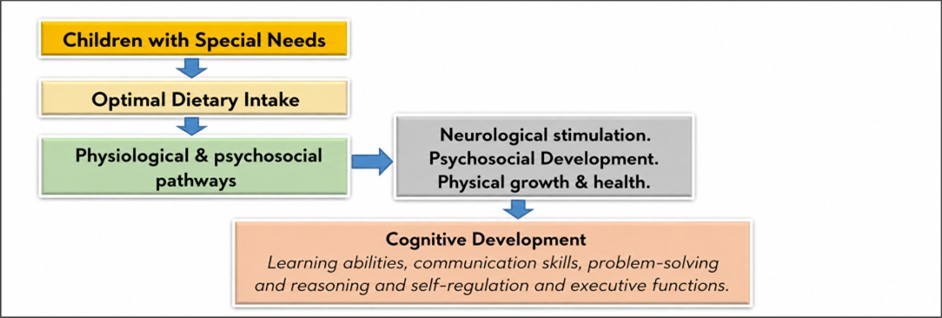
Download figure
Methodology
Study Area
This baseline study was conducted within Kakamega County that is made up of 12 sub-Counties namely: Mumias, Matungu, Kakamega Central, Navakholo, Khwisero, Butere, Kakamega North, Kakamega South, Kakamega East, Likuyani, Lugari and Matete 9. The County has an area of 3,033.8 km2 and population of 1,867,579 which is projected to increase to 2,658,577 in 2030 9. The County’s population age structure is notably youthful with 46.7 percent comprising of the population below aged 15 years 9. Approximately 329,041 is the population of children aged below five years, with 164,393 females and 164,648 males. However, there are no existing records with population of children below five years. According to the Kakamega County Task Force Report (2014), there are 917 Early Childhood Development (ECD) centers accredited by National Council for Persons with Disabilities to offer education to children with special needs, however the enrolment in ECD centers was as low at 9,000. Out of the 917 ECD centers in Kakamega County, only 300 enroll children aged below five years with 50 housing children with various special needs 10.
Study Design and Population
This was a baseline study that involved collection of quantitative data within the month of June to July, 2025. The target population was mother/child caregiver-child pairs of special children aged below the age of five years living with autism, deaf, Attention Deficit Hyperactivity Disorder (ADHD), blind, physically disabled and diagnosed with cognitive development impairment who were enrolled in an Early Childhood Educational Center in Kakamega County.
Sampling Techniques and Sample size
Kakamega County was purposively sampled because despite national efforts to improve early childhood development, children with special needs of this region continue to face developmental risks linked to poverty and cultural backgrounds. These factors ultimately hinder optimal dietary intake of these children thus contributing to cognitive development impairment among other challenges, which warrants focused investigation. ECD centers were proportionately sampled according to the 12 sub counties of Kakamega County. Simple random sampling was then employed on each stratum (sub-counties) to get the sample population of early childhood educator-child pair. Cochran formula of (1977) was used to calculate a representative sample size of 90 mother/child caregiver-child pairs. With an inclusion criteria of children with Autism, Deaf, ADHD, Blind, Physical disabled and diagnosed with cognitive development impairment.
Data Collection
Data was collected by 6 trained researcher assistants within the month of June to July, 2025 amongst 90 mother/child caregiver-child pairs within ECD centers sampled from sub Counties of Kakamega County.
Dietary Intake
The main respondents were the mother/child caregiver of the index child who were willing to participate in this study. They were interviewed using a pre-tested questionnaire to gather data on socio-demographic characteristics of the child and their parents. In determining the dietary intake of children, food frequency questionnaire (FFQ) was used. The FFQ approximates the typical dietary intake of a child for up to one month. In this study, it was administered to the mother/child caregiver to determine the average daily food intake of the children based on locally consumed foods in the region. The mother/child caregiver of the children were probed and model pictures of local foods used to ask if the children had consumed certain foods in the past month and if so, in what estimated amount per each meal. The computed daily nutrient intake was compared with the Recommended Daily Intakes (RDI)s. The RDIs as shown in Table 3 provided average daily consumption of foods that were adequate to meet the nutrient requirement for these children. The key nutrients for this study were energy, proteins, zinc, iron and vitamin A. The FFQ for this study had a total of 26 locally consumed foods. Mother/Caretakers assented and gave this information on behalf of their children.
A pre-tested dietary diversity questionnaire adopted from the Food and Nutrition Technical Assistance (FANTA) 11 was used to capture information of dietary consumption over a period of seven (7) days. The reference period was chosen according to Food and Agriculture Organization (FAO) guidelines for measuring household and individual dietary diversity 12. The caregivers/mothers were asked whether; the children had eaten foods from the seven (7) main food groups over the past seven days and the number of days they had consumed foods from each food group. Data gathered were recorded accordingly from the following food groups; Grains, roots or tubers and plantain, Vitamin A-rich plant foods, Other fruits and vegetables, Flesh foods (Meat, poultry, fish), Egg, Pulses, legumes or nuts, Milk and milk products. The individual dietary diversity score (IDDS) was calculated for each special need. It was calculated as follows: every child who had consumed foods from a particular food group for more than five days in the past week was scored 1. The total number of 1 score each child had gotten was added up, as their individual dietary diversity score. The highest dietary diversity score was 7. However, sugary foods were not added to the scoring. The average dietary diversity score of the subjects was also calculated. The minimum dietary diversity of the children in the ECD centers was calculated using the formula;
(Number of children who received food from 4 or more food groups in the past 7 days ÷ Number of children (100)) × 100%
Nutritional Status
Anthropometric measurements were collected; weight was measured following standard protocol adapted from World Health Organization 13. Height/length was measured for children who did not have any deformities/contracture and could stand independently. Mid-upper arm circumference (MUAC) and knee height was measured for children aged 5 years who could not stand independently due to scoliosis. The collected measurements were compared with the WHO reference population to classify the nutritional status of participating children. During the interview with the primary caregivers, the researcher assistants also collected information about feeding characteristics of participating children.
Cognitive Development Outcomes assessment
Cognitive development outcomes in children were assessed using Bayley Scales of Infant and Toddler Development-iv (BSID-iv) that had 5 domains (cognition, motor, language, socio-emotional, adaptive behavior including questions for caregivers) 14. The Bayley Scales of Infant and Toddler Development-iv (BSID-iv) was modified to fit the study variables and assess cognitive development outcomes as; learning abilities, communication skills, problem-solving and reasoning, self-regulation and executive functions. This tool assessed cognitive development outcomes by how children remembered certain tasks, reacted, learned and manipulated the surrounding environment, how they counted, explored objects visually and physically, assembled objects, finished a puzzle, identified colors, matched masses, discriminated patterns, how they presented an imaginary play etc. This was collectively categorized as learning abilities, communication skills, problem-solving and reasoning and self-regulation and executive functions. These tasks were ranged from basic to complex depending on the child’s special needs. With the assistance of the research assistants, caretakers were instructed on the tasks as they observed and scored. During the assessment the caretakers were advised not to talk or aid the child, thereby avoiding skewed deviations. In some tasks, children were given up to one minute and others were given up to three trials before a score was given. A completed task earned one mark while incomplete or failed task earned zero mark. The researcher assistants scored each task and then tallied; the composite scores were computed and categorized. Each BSID kit had a manual, forms, caregiver reports, observation Checklist, and manipulative set. After the assessment, the assessor summarized standard and scaled scores.
Ethical considerations
Ethical clearance was obtained from the MMUST Institutional Ethics Review Committee (IERC). Research permit was granted by National Commission for Science Technology and Innovation (NACOSTI). Permission was obtained from managers of respective ECD centers that were involved in the baseline survey. Written informed consent was obtained from all parents or legal guardians for eligible children who were informed on the research procedures, details and assured of confidentiality.
Results
Demographic Characteristics of Children
The demographic characteristics for the children were summarized in Table 1. Overall this study included children aged 3-5 years, three years is the recommended age for children enrolling for Early Childhood Education in Kenya. Gender wise, most children were males at 60 percent. Regarding disabilities, the prevalence of autistic children was the highest at 44.4 percent with blindness being the least at 7 percent. For the class distribution 10 percent were in play group while 60 percent were in Pre-Primary, 2 (PP2).
Table 1. Demographic Characteristics of Children| CATEGORY | FREQUENCY (%) |
|---|---|
| Age (Years) | |
| 3–5 | 90 (100%) |
| Gender | |
| Males | 54 (60%) |
| Females | 36 (40%) |
| Type of Disability | |
| Autism | 40 (44.4%) |
| Deaf | 12 (13.3%) |
| ADHD | 14 (15.5%) |
| Blindness | 6 (7%) |
| Physical disabled | 18 (20%) |
| Class Distribution | |
| Play Group | 9 (10%) |
| PP 1 | 27 (30%) |
| PP 2 | 54 (60%) |
Demographic Characteristics of Parent’s Children
Table 2, summarized the demographic characteristics of the parents’ children, with 70 percent reported to be between the age of 18-25 years, which is an interesting finding that needs further research. Approximately 56 percent had received tertiary education despite a significant percentage of 70 having no employment implying that their children received sponsorship to ensure they were maintained in ECD centers. It was interesting to note that 80 percent of these children’s parents were not married while most females at 90 percent had the responsibility of taking care of the children.
Table 2. Demographic Characteristics of Parent's Children| VARIABLE | FREQUENCY (%) |
|---|---|
| Age (Years) | |
| Below 18 | 8 (8.8%) |
| 18–25 | 63 (70%) |
| 26–33 | 9 (10%) |
| 34–41 | 8 (8.8%) |
| Above 42 | 2 (2.2%) |
| Level of education | |
| No formal education | 6 (7%) |
| Primary education | 9 (10%) |
| Secondary education | 10 (11%) |
| Tertiary education | 50 (56%) |
| Higher education | 15 (16%) |
| Nutrition Knowledge | |
| Low level | 66 (73%) |
| Moderate level | 6 (7%) |
| High level | 18 (20%) |
| Occupation | |
| Employed | 27 (30%) |
| Not employed | 63 (70%) |
| Marital Status | |
| Married | 9 (10%) |
| Single | 72 (80%) |
| Divorced | 9 (10%) |
| Responsible for the Child | |
| Man | 9 (10%) |
| Woman | 81 (90%) |
Nutrient Adequacy of Children
Findings summarized in Table 3, indicated energy was the only nutrient that was adequate for most children (89 percent). The observed high energy intake is perhaps attributed by high amount of carbohydrates in the consumed diets. Micronutrient intake was calculated based on the individual foods consumed. However, from the findings zinc nutrient was the least adequate with majority of children 89 percent not having the adequacy. The adequacy of vitamin A, iron and protein was also below recommended dietary intake for 66.7 percent, 76.7 percent, 62.3 percent of the children respectively. Kenya National Food composition table (2018) was used to obtain nutritional composition of food items listed in the 24-hour recall.
Table 3. Nutrient Adequacy (n = 90)| Micronutrient | Adequacy Status | RDI | n | % |
|---|---|---|---|---|
| Vitamin A | Adequate | 400 µg RE | 30 | 33.3 |
| Inadequate | 60 | 66.7 | ||
| Iron (mg) | Adequate | 10 mg | 21 | 23.3 |
| Inadequate | 69 | 76.7 | ||
| Zinc (mg) | Adequate | 10 mg | 10 | 11 |
| Inadequate | 80 | 89 | ||
| Protein (g) | Adequate | 15.5 g | 34 | 37.7 |
| Inadequate | 56 | 62.3 | ||
| Energy (kcal) | Adequate | 1050 kcals/day | 80 | 89 |
| Inadequate | 10 | 11 |
Frequency of consumption of foods by children
The main food group consumed was foods from cereals, roots tubers and plantain 44.4 percent. Consumption of flesh foods (meat and fish), fresh/dried fish, meat, eggs, legumes/nuts and dairy which are protein food sources was very poor and disturbing as summarized in Table 4. The protein food sources which are very essential for the general development of children below five years were not consumed by a significant proportion; flesh foods (meat and fish) 77.7 percent, flesh or dried fish 97.7 percent, meat 88.8 percent and eggs 73.3 percent. Other fruits or vegetables were consumed by 83 percent at a frequency of 3-5 times. More than half of the children 60 percent consumed sweets at a frequency of 6-7 times though it has very minimal nutritional benefits. Table 4 gives detailed frequency of consumption of the foods, from the food groups over the past seven days.
Table 4. Frequency of consumption of the foods| FOOD GROUPS | Frequency of Consumption per Week Frequency (%) | |||
|---|---|---|---|---|
| 6–7 times | 3–5 times | 1–2 times | Never | |
| Foods from cereals, roots tubers and plantain | 40 (44.4) | 35 (38.8) | 15 (16.6) | 0 (0) |
| Vitamin A rich fruits and vegetables | 10 (11.1) | 17 (18.8) | 63 (70.0) | 0 (0) |
| Other fruits or vegetables | 6 (6.6) | 75 (83.0) | 4 (4.4) | 5 (5.5) |
| Flesh foods (Meat and fish) | 0 (0) | 0 (0) | 20 (22.2) | 70 (77.7) |
| Fresh or dried fish | 0 (0) | 0 (0) | 2 (2.2) | 88 (97.7) |
| Meat | 0 (0) | 0 (0) | 10 (11.1) | 80 (88.8) |
| Eggs | 0 (0) | 0 (0) | 24 (26.6) | 66 (73.3) |
| Foods from legumes and nuts | 0 (0) | 8 (8.8) | 82 (91.1) | 0 (0) |
| Dairy products | 0 (0) | 30 (33.3) | 56 (62.2) | 4 (4.4) |
| Sweets | 54 (60.0) | 20 (22.2) | 16 (17.7) | 0 (0) |
Dietary Diversity Score of Children 6-23 Months
For this indicator, the dietary diversity score was created by summing the number of food groups consumed over a 24-hour period to aid in understanding how diverse the children’s diets were. The food groups were determined based on the WHO guidelines of 2012, Criteria for classification of dietary diversity score (DDS) was based on low DDS (0-3 food types), medium DDS (4-6 food types) and high DDS (above 6 food types) and summarized in Table 5.
Table 5. Dietary Diversity Score by Special Needs| Type of Disability | Dietary Diversity Score by special needs | ||||||||
|---|---|---|---|---|---|---|---|---|---|
| 1 | 2 | 3 | 4 | 5 | 6 | 7 | Total | Minimum DDS (%) | |
| Autism | 0(0) | 1(2.5) | 19 (47.5) | 18 (45) | 2 (5) | 0(0) | 0(0) | 40 | 50 |
| Deaf | 0(0) | 0(0) | 6 (50) | 5 (42) | 1 (8) | 0(0) | 0(0) | 12 | 50 |
| ADHD | 0(0) | 2(14.2) | 7(50) | 5(35.7) | 0(0) | 0(0) | 0(0) | 14 | 35.7 |
| Blind | 0(0) | 1(16.6) | 1 (16.6) | 4(66.4) | 0(0) | 0(0) | 0(0) | 6 | 66.6 |
| Physical disabled | 0(0) | 4(22.2) | 6 (33.3) | 8 (44.4) | 0(0) | 0(0) | 0(0) | 18 | 44.4 |
| Frequency (%) | 0(0) | 8(8.8) | 39(43.3) | 40(44.4) | 3(3.3) | 0(0) | 0(0) | 90 | 47.7 |
The minimum dietary score for children who consumed foods from four or more food groups was 47.7 percent. High dietary diversity score was not attained by any child; neither was DDS of 1. For autism, a medium dietary diversity score was achieved by 20 out 40 children. Half of the children (6 out of 12) who were deaf achieved medium dietary diversity score and low dietary diversity score respectively. Most children with ADHD (9 out of 14) achieved a low dietary diversity as compared to the blind children whose significant proportion (4 out of 6) attained a medium dietary diversity score. Physically disabled children significantly scored a low dietary diversity score of 10 out of 18.
Nutrition Status of Children
According to the findings summarized in Table 6, no child experienced over-nutrition across the special needs. Healthy weight also known as normal weight was prevalent amongst deaf (66.6 percent) and blind (66.6 percent) children. Moderate under-nutrition was significantly high amongst the autistic children at 50 percent. This same group of children also recorded 5 percent prevalence of severe undernutrition while the physically disabled having a comparatively high prevalence of 22.2 percent for the same characteristic’s.
Table 6. Nutritional status of participating children| Characteristics | Type of Special Needs | ||||
|---|---|---|---|---|---|
| Nutritional status | Autism | Deaf | ADHD | Blind | Physical disabled |
| Over–nutrition | 0 (0) | 0 (0) | 0 (0.0) | 0 (0.0) | 0 (0.0) |
| Normal | 18 (45) | 8 (66.6) | 9 (64.2) | 4 (66.6) | 8 (44.4) |
| Moderate undernutrition | 20 (50) | 4 (33.4) | 5 (35.8) | 2 (33.4) | 6 (33.3) |
| Severe undernutrition | 2 (5) | 0 (0) | 0 (0) | 0 (0) | 4 (22.2) |
| Total | 40 | 12 | 14 | 6 | 18 |
Feeding Characteristics of Children
As reported from the summarized Table 7, all the children having ADHD needed no assistance during feeding as they could eat/feed on their own. The was no child who being fed using tube/tube feeding which was encouraging to observe. However, 66.7 percent of the blind children needed to be fed by others. However, 12.5 percent of autistic children and 38.8 of physically disabled could partially manage to feed by themselves.
Table 7. Nutritional status of participating children| Characteristics | Type of Special Needs | ||||
|---|---|---|---|---|---|
| Feeding Characteristics | Autism | Deaf | ADHD | Blind | Physical disabled |
| Self-fed | 30 (75) | 10 (83.3) | 14 (100) | 2 (33.3) | 3 (16.6) |
| Need to be fed by others | 5 (12.5) | 2 (16.7) | 0 (0) | 4 (66.7) | 8 (44.4) |
| Can partially manage eating by self | 5 (12.5) | 0 (0) | 0 (0) | 0 (0) | 7 (38.8) |
| Tube-fed | 0 (0) | 0 (0) | 0 (0.0) | 0 (0.0) | 0 (0.0) |
| Total | 40 | 12 | 14 | 6 | 18 |
Relationship between Cognitive Development outcomes and Special needs
Cognitive development skills refer to the mental capabilities that enable children to process information, reason, remember and relate concepts. According to Figure 2, autism is shown with relatively low levels across all cognitive domains, with slightly higher problem solving 12 percent than others. Among the deaf group, the figure shows moderate to high scores in reasoning at 30 percent and executive functions at 25 percent, but lower in communication reported at 10 percent. The prevalence of communication was high at 30 percent while problem solving skill was the lowest at 10 percent. The blind group was portrayed with exceptionally high problem solving skills at 45 percent and learning ability with 35 percent potentially implying their cognitive domains surge due to adaptation. Physically disabled individuals reported particularly high communication at 60 percent and learning at 50 percent but low problem solving skill at 15 percent.
Figure 2. Cognitive Development Outcome 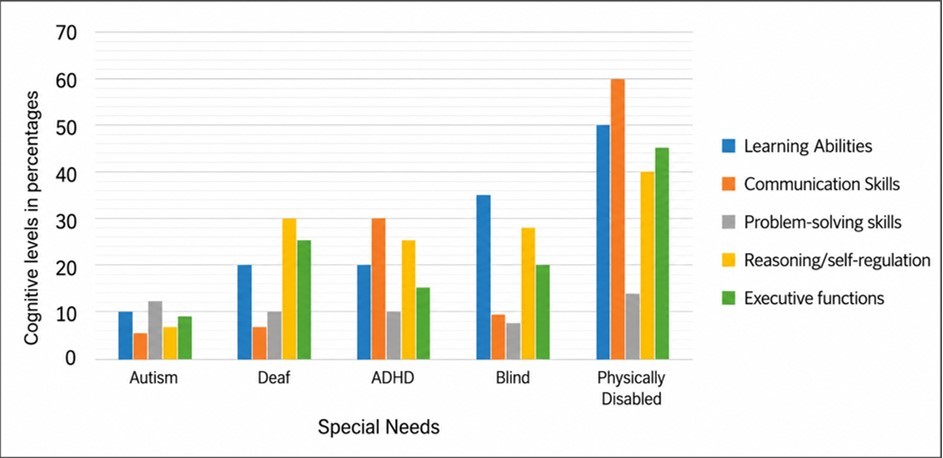
Download figure
Discussion
All the children of this research had an age range of 3-5 years that was consistent with the early childhood development (ECD) phase of critical period for cognitive development. According to the UNICEF (2020) framework on ECD, early intervention during this age can significantly impact long-term cognitive outcomes, especially for children with special needs. A focus on this age group aligns with global and regional best practices emphasizing early detection and intervention. Males were more represented 60 percent than females 40 percent. This skewed gender ratio is consistent with other studies. Research from Astakhova (2020) shows that conditions such as autism spectrum disorder and ADHD are more frequently diagnosed in males. Cieri et al., (2023) also found higher enrollment of boys than girls in special needs education programs. The high rate of autism 44.4 percent was notable. Globally, the prevalence of autism has increased in recent decades, partly due to better awareness and diagnostic tools 15. A study by Nambisan & Harish (2023) suggested that autism is more prevalent than previously thought in Sub-Saharan Africa but remains underdiagnosed due to limited resources. In the previous past, Mitchell et al., (2017) found increasing identification of autism in urban centers and special schools, mirroring findings from this current study. Physical disabilities 20 percent remain a significant portion, often due to birth complications, injuries, or conditions like cerebral palsy which are prevalent in many parts of rural Kenya due to limited prenatal and perinatal care. The level of education of parents of these children was relatively high, since 56 percent had tertiary education. However, from this same group of parents, 73 percent had low nutritional knowledge about dietary intake of their children with special needs. UNICEF (2020) highlights that parents’ education level directly affects child outcomes, especially in health, nutrition, and stimulation for children with disabilities. In contrast to UNICEF (2020) finding, this study established that the parents may be generally educated but still have no positive impact on the child dietary intake, thus parents need to have adequate nutrition knowledge for the benefit of their children. Unemployment of 70 percent was a major challenge for parents. Globally, the World Health Organization 16 notes that families with disabled children experience significantly higher financial burdens and lower workforce participation, especially for women. This high unemployment rate reinforces the link between economic insecurity and poor nutritional/cognitive outcomes for children with special needs. This finding is striking, having 80 percent of caregivers being single, with only 10 percent married and 10 percent divorced. The high percentage of single mothers’ mirrors findings in Africa where men often disengage after a child is diagnosed with a disability 3. The gender of primary caregivers 90 percent being women and only 10% men aligns with other studies in African contexts that reveal that women are overwhelmingly the primary caregivers, regardless of marital status 17, 7, 18. This reinforces the need for gender-sensitive policies and programs to emphasizes male involvement in caregiving/day to day care of these children with special needs.
Vitamin A is crucial for vision, immune function, and brain development, however 66.7 percent of children had inadequate Vitamin A intake, with only 33.3 percent meeting the RDI (400µg RE). According to UNICEF (2020), about 48 percent of children under 5 in Kenya are at risk of vitamin A deficiency. These findings highlight a critical gap, suggesting the need for targeted supplementation programs (e.g., school-based) and nutrition education for caregivers of children with special needs. Vitamin A deficiency (VAD) is a widespread problem in Kenya, and children with special needs are at even higher risk due to feeding difficulties, sensory aversions, or poor diet variety. Iron deficiency is one of the most common micronutrient deficiencies among children in Kenya even as revealed in this current study with 76.7 percent of children having inadequate iron intake, only 23.3 percent meeting the RDI (10 mg/day). The Kenya National Micronutrient Survey 19 reported that 46 percent of preschool children were iron deficient, but the risk is higher among children with special needs due to poor absorption and dietary limitations. Thus, iron fortified foods, iron supplementation and interventions that promote iron rich local foods should be broadly established since iron is critical for cognitive development. Zinc supports immune function, growth, and brain development; its deficiency can delay neurodevelopmental milestones. This was a most severe gap in this study with only 11 percent meeting the RDI of 10 mg/day, with a concerning 89 percent deficiency rate. In children with special needs, feeding challenges and restricted diets often lead to low meat and dairy intake, which are primary sources of zinc. Protein is essential for brain growth, neurotransmitter synthesis, and muscle development though it is a known issue in Kenyan children, particularly in low-income and rural settings as established in this current study that reported 62.3 percent of children had inadequate protein intake, while only 37.7 percent met the 15.5g/day RDI. Supporting this finding, previously the Kenya Demographic and Health Survey (2014) reported moderate to high levels of protein-energy malnutrition among under five years in western Kenya. Children with disabilities often face challenges like oral-motor dysfunction, texture aversion, or poor appetite, contributing to inadequate protein intake 13. Energy intake of 89 percent meeting the RDI of 1050 kcal/day was a positive finding compared to other nutrients, suggesting that caloric intake is sufficient, though micronutrient density was still poor. While energy needs are being met through these staples, they are low in micronutrients, which contributes to the “hidden hunger” as reflected in vitamin and mineral deficiencies. Though encouraging, 83 percent consumed 3–5 times/week, only 6.6 percent consumed daily, the low daily intake indicates gaps in nutrient density. Low intake of flesh foods contributes to iron and zinc deficiencies (76.7 percent and 89 percent respectively), which are critical for brain development and functioning. The finding on consumption of meat and fish was alarmingly low but aligns with findings in economically disadvantaged areas with 77 percent who never consumed the food item. Thus a need to support strategies of small livestock support programs, or community-based fish farming to improve access to protein foods.
The overall finding of less than half (47.7 percent) of children with special needs meeting the minimum dietary diversity score (DDS) aligns with research in low-resource settings 11. According to WHO (2019) only 30–50 percent of young children in Sub-Saharan Africa meet the recommended DDS. Children with special needs in Kakamega, like in many rural regions, do not meet nutritional diversity standards, which increases their risk of micronutrient deficiencies, stunting, and cognitive delays 6. Children with autism (DDS ≥4: 50 percent) often experience sensory sensitivities and food aversions, leading to monotonous diets. Children with hearing impairment (DDS ≥4: 50 percent) generally do not face physical barriers to eating but may face communication challenges that limit food preferences being expressed or understood. Cognitive development outcomes showed that autistic children were slightly better in problem-solving (14 percent) and reasoning (12 percent) while the deaf revealed weaker communication skills 10 percent which establishes that deficits in language development and expressive communication. The blind children were stronger in learning (35 percent) and reasoning (28 percent), and weak in communication (10 percent) and executive functions (20 percent). This implies educational support should harness verbal learning strengths and improve orientation and executive planning skills. The physically disabled reported highest performance across all domains, communication (60 percent), learning (50 percent), executive functions (45 percent). Concurrently, Cieri et al., 2023 in Kenya found that children with physical disabilities excel when physical barriers are removed, such as via assistive devices. This implies that their cognitive potential is high; barriers are often environmental, not intellectual and supportive policies can enhance outcomes further.
Conclusion
These findings highlight the urgent need for special needs-specific nutrition interventions, caregiver feeding support training, and inclusive early childhood education policies. Establishing robust school feeding programs and improving access to diverse, nutrient-rich foods are essential to enhancing cognitive outcomes for children with special needs in Kakamega County and similar contexts.
Clinical trial number
Not Applicable
Author Contributions
All authors have participated in the drafting of the manuscript, have proofread and agreed to have it published.
Institutional Review Board Statement
Ethics approval was obtained from the Masinde Muliro University of Science and Technology, Institutional Scientific and Ethics Review Committee (MMUST-ISERC) that reviewed and approved the research (MMUST/ISERC/087/2025).
Informed Consent Statement
Informed written consent was obtained from the mothers/primary caregivers of all participating children.
References
- 1.Benton D. (2010) The influence of dietary status on the cognitive performance of children. Mol Nutr Food Res 54(4), 457-470.
- 2.Chen D, Neville K J, Massey L, Burbelo G A, Blankenbeckler P N et al. (2019) Toward a definition of complex cognitive skill. Proceedings of the Human Factors and Ergonomics Society Annual Meeting 63, 1445-1449.
- 3.Hasanah U, Shimizu K. (2020) Crucial cognitive skills in science education: A systematic review. Journal Penelitian dan Pembelajaran IPA. 6(1), 36-72.
- 4.Joshi H. (2014) Non-cognitive ’skills: What are they and how can they be measured in the British cohort studies. Retrieved from London. 1-29.
- 5.Hammersley M, Buchanan L, Xu H, Wen L. (2022) Early childhood dietary intake and subsequent socioemotional and cognitive school readiness among Australian children. Health Education & Behavior 49, 861-870.
- 6.Astakhova L, V. (2020) The concept of student cognitive culture: Definition and conditions for development. The Education and Science Journal 21(10), 89-115.
- 7.Liu T, Broverman S, E S Puffer, D A Zaltz, A L Thorne-Lyman et al. (2022) Dietary Diversity and Dietary Patterns in School-Aged Children in Western Kenya: A Latent Class Analysis. Int. J. Environ. Res. Public Health 19, 9130-10.
- 8.Nambisan D, Harish R. (2023) The effects of nutrition on the cognitive development of children with learning disabilities. International Journal of Scientific Research 38-39.
- 9.KNBS, ICF. (2023) Kenya Demographic and Health Survey 2022. Key Indicators Report. , Nairobi, Kenya, and Rockville, Maryland, USA: KNBS and ICF
- 10. (2014) Kakamega County Task Force Report. Kenya Institute of Education; Guidelines for Early Childhood Department. Government press. , Nairobi
- 12.FAO. (2016) FHI 360. Minimum Dietary Diversity for Women: A Guide for Measurement; FAO:. , Rome, Italy
- 13. (2010) World Health Organization. Monitoring the Building Blocks of Health Systems: A Handbook of Indicators and their Measurement Strategies. , Geneva: WHO;
- 14.Bayley N, Aylward G. (2019) . Bayley Scales of Infant and Toddler Development: Technical manual (4th ed.) , NCS Pearson .
- 15.Sadoo S, Nalugya R, Lassman R, Kohli-Lynch Chariot, Davies G et al. (2022) Early detection and intervention for young children with early developmental disabilities in Western Uganda: a mixed-methods evaluation. BMC Pediatr 22, 158-10.
- 17.Noor A, Shaukat R, Abbas S Q. (2024) Effects of dietary intake on cognitive skills of physically challenged children. Professional Med J 31(09), 1381-1389.
- 18.Roberts M, Tolar-Peterson T, Reynolds A, Wall C, Reeder N et al. (2022) The effects of nutritional interventions on the cognitive development of preschool-age children: A systematic review. Nutrients 14(3), 532-10.
- 19.Survey. Kenya National Micronutrient (2011) . Kenya National Bureau of Statistics (KNBS), Division of Nutrition, Ministry of Public Health and Sanitation (MOPHS), Kenya Medical Research Institute (KEMRI). KEN_2011_NMS_v01_M .
- 20.M E Cieri, Brunner M M R, A L Condinanzi, Escobar J, Cuestas E. (2023) Nutritional status and dietary intake of children and adolescents with cerebral palsy. Clin. Nutr. ESPEN 57, 391-398.
- 23. (2014) Kenya Demographic and Health Survey. National Bureau of Statistics-Kenya and ICF International. , Rockville, Maryland, USA:, KNBS and ICF International
- 24.Mitchell E, Roy P G, Odeh C S, Fannin D K, Barrett S C. (2017) The impact of family style meal and modeling on dietary behaviors and intake of children participating in a developmental playgroup. The FASEB Journal 31, 958-23.